Three-dimensional inspection of steam turbine
Steam turbines are the main equipment of modern thermal power plants. Rotary steam power plants are used in the metallurgical industry, chemical industry, ship power plants, staggered blade rotating rotors. The customer needs to scan the rotating blade rows of the steam turbine for a comparative analysis of the data. Our company's new handheld 3D scanner is used to fully scan a sample to obtain the required data and apply it to the work of a steam turbine to make a better device.
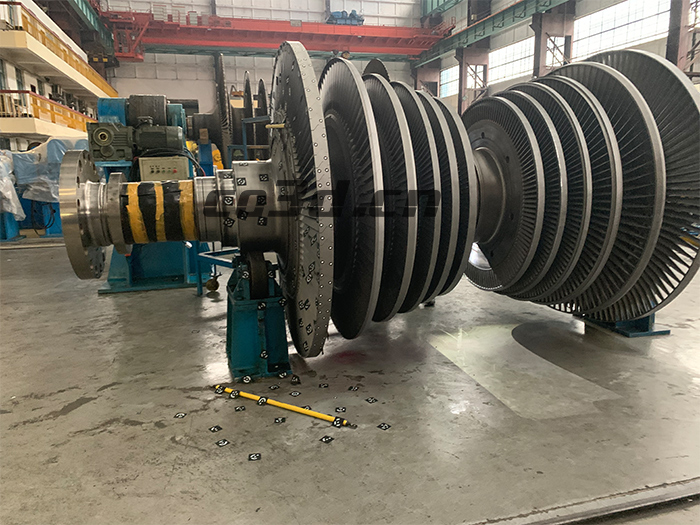
Turbine blade scan scene
Facing problems
The steam turbine has a large volume and a large shape, and the gap between the blade rows is small, which easily forms an included angle. Customers need high scanning data accuracy, good scanning technology, and can complete work in a short time, which is very challenging.
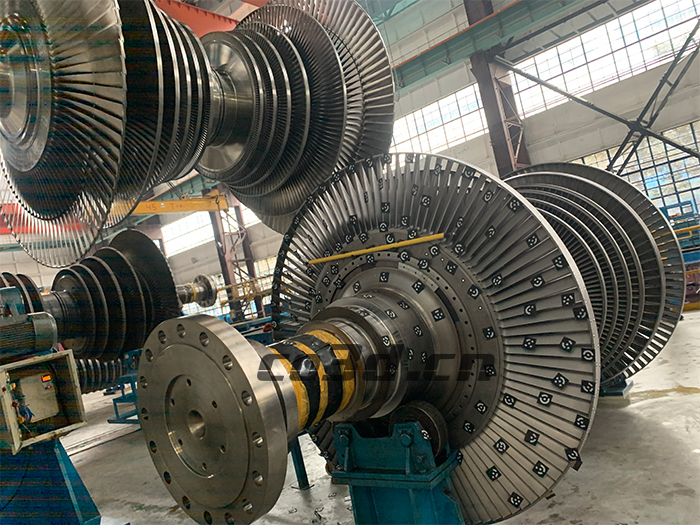
Turbine blade scan scene
Traditional scanning methods have limitations in use. The sample is too large, it is not easy to decompose, it takes too much time, it cannot meet the demand, and the problem is quickly solved.
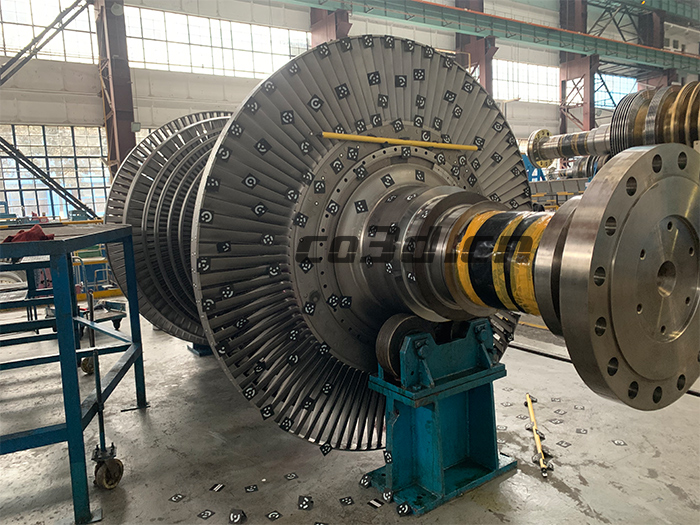
Turbine blade scan scene
Co3d solution
Regardless of sample size, we have equipment suitable for scanning. To allow customers to scan steam turbines, our engineers used a three-dimensional photogrammetry system HL-3DP for full scans. First paste the code points, then capture the image from different angles, and then import the images into the HOLON3DP software for processing. The software will automatically combine the images to calculate the 3D coordinates of the code points.
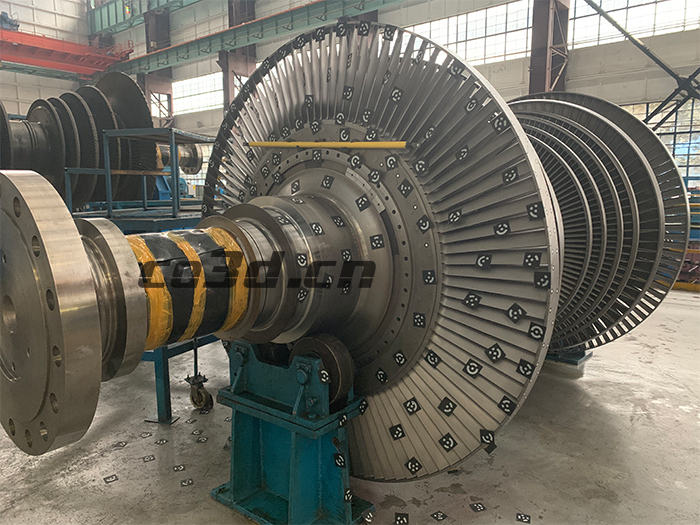
Turbine blade scan scene
The acquired 3D data is then imported into 3D software for comparison and analysis with the original data to generate a test data analysis report. The details are scanned well, the data is complete, and the problem can be seen directly. Customers are very satisfied with the data we scan and can really solve the problem. Based on the test data, the design of the turbine can be improved to produce a more competitive product.
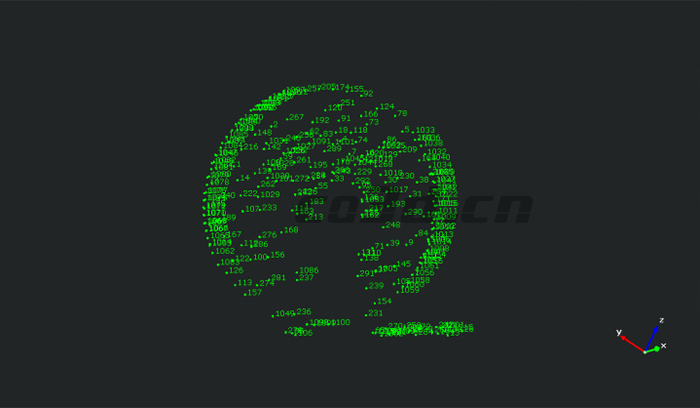
Turbine blade point cloud data graph
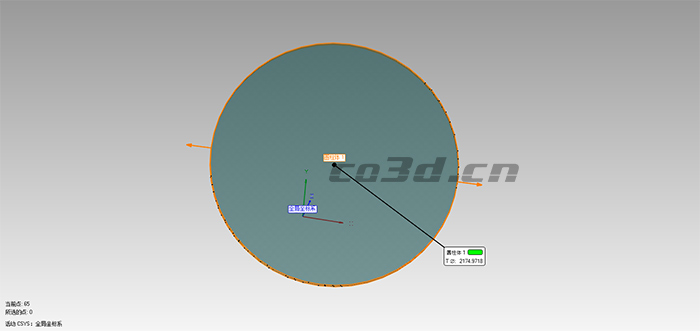
Turbine blade measurement data graph